
$842 billion. That’s what the U.S. home services industry is worth in 2026, and it’s still growing. If you run a trade business, these numbers aren’t abstract market research. They’re the backdrop to every hiring decision, pricing conversation, and marketing investment you’re making this year.
This guide pulls together the most reliable home services industry statistics available into one authoritative reference. It covers every major vertical: painting, tree care, landscaping, electrical, plumbing, handyman, windows, doors, and garage doors. It also examines the macro forces shaping every segment: the aging housing stock, the digital booking shift, the skilled labor shortage, and the smart home boom.
Every statistic is sourced and contextualized for real business decisions. Here’s what the data says.
What Do Home Services Industry Statistics Tell Us About U.S. Market Size in 2026?
The scale of the home services market depends on how broadly you define it. Different research methodologies produce dramatically different figures. At the narrow end, The Business Research Company pegs the global home services market at $463.93 billion in 2026, growing at a 9.2% CAGR [1]. At the broad end, GM Insights values the global market at $970.3 billion, growing at a more measured 4.1% CAGR [2]. Technavio takes the widest view, projecting $1,029.6 billion in incremental expansion between 2024 and 2029 at a 10.5% CAGR [3].
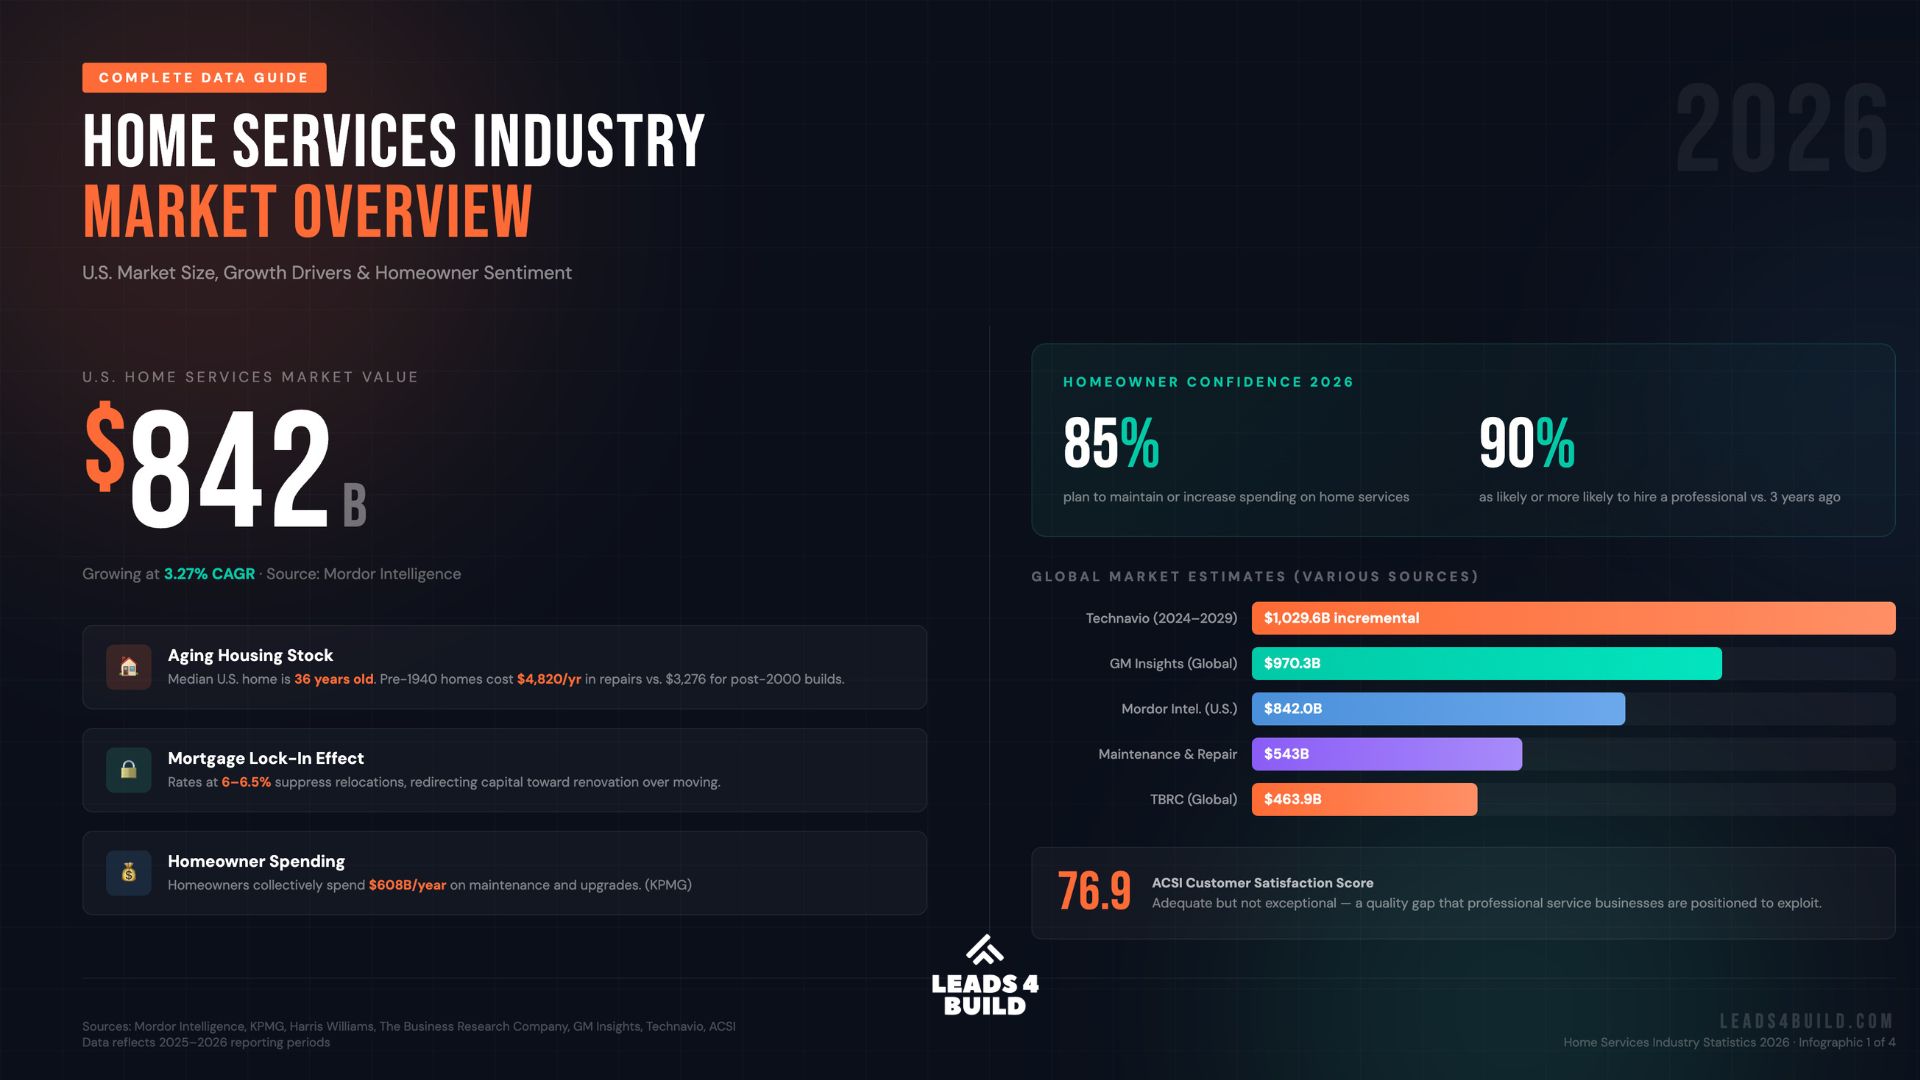
For U.S.-focused analysis, Mordor Intelligence estimates the domestic home services market at $842.04 billion in 2026, advancing at a 3.27% CAGR [4]. A narrower cut focused on home maintenance and repair specifically puts that segment at $543 billion in 2025, growing at 5.3% CAGR through 2030 [5]. KPMG reports that homeowners collectively spend $608 billion per year on maintenance and upgrades [6].
No matter which lens you use, this is a market measured in the hundreds of billions. For individual contractors and service businesses, that scale translates into durable demand across nearly every trade category.
What Is Driving U.S. Home Services Market Growth in 2026?
The single biggest structural driver is the age of America’s housing stock. The median U.S. home is now 36 years old (2025), and homes built before 1940 cost an average of $4,820 per year in repairs, compared to $3,276 for homes built after 2000 [5]. That gap of nearly $1,600 per year, multiplied across tens of millions of aging homes, creates a structural floor of demand that persists regardless of broader economic conditions.
Mortgage rates running between 6% and 6.5% are suppressing the move-up market and redirecting homeowner capital toward renovation rather than relocation [11]. When moving is expensive, improving becomes rational. Contractors benefit directly. This lock-in effect has been a steady tailwind since 2023 and shows no sign of reversing in the near term. HVAC contractors looking to capture that demand organically should review the HVAC local SEO guide for actionable ranking strategies.
For a deeper look at how one major trade is capitalizing on these macro forces, the HVAC Statistics and Trends guide covers the HVAC segment’s specific growth drivers in granular detail.
How Confident Are Homeowners About Spending on Home Services in 2026?
Homeowner sentiment in 2026 is meaningfully optimistic. 85% of homeowners plan to maintain or increase their spending on home services compared to prior years, and 90% say they are as likely or more likely to hire a professional compared to three years ago [11].
That shift toward professional hiring rather than DIY is one of the most commercially significant trends in the market.
The American Customer Satisfaction Index (ACSI) scores home services at 76.9 out of 100 [72], which is adequate but not exceptional. That score reflects a persistent quality gap in the industry, one that well-run, professional service businesses are positioned to exploit. Homeowners are spending more and expecting more; companies that deliver a consistent, professional experience are winning disproportionately.
How Are Homeowners Booking Home Services in 2026?
Despite the dominance of digital marketing, 65.13% of home services bookings are still completed offline (by phone, in person, or through word of mouth) [7]. Online booking is growing at a 3.56% CAGR, but the phone call remains the primary conversion mechanism for the majority of home services transactions.
The phone call isn’t dead. It just starts on a smartphone.
84% of home services bookings initiate on mobile devices in 2026 [7]. Homeowners are searching, comparing, and vetting contractors on their phones before making contact through any channel. Being discoverable and credible on mobile is non-negotiable.
How Fast Is Field Service Management Software Growing?
The field service management (FSM) software market reflects the operational complexity of running a modern home services business. The market was valued at $5.64 billion in 2025 and is projected to reach $9.68 billion by 2030 [9], nearly doubling in five years. The adoption drivers are practical: 68% of FSM adoption is driven by mobile workforce management, followed by 61% using real-time service tracking and 54% using automated scheduling [10].
For contractors, the implication is straightforward: businesses investing in software to manage dispatch, scheduling, and customer communication are gaining structural operational advantages over those still running on spreadsheets and text messages. FSM adoption is no longer a differentiator. It is becoming a table stake.
What Do Homeowners Look for When Hiring a Home Services Company?
96% of homeowners say a recognizable brand is important when hiring a home services company, and 79% still prefer hiring a company they perceive as local [10]. These two data points aren’t contradictory. Homeowners want the accountability of a local business combined with the professionalism of a recognized brand.
This dual preference is exactly why contractor marketing increasingly emphasizes both local SEO (to appear local) and consistent brand identity (to appear trustworthy). The Remodeling Marketing Guide covers how to build that brand presence across digital channels in practical terms.
How Severe Is the Labor Shortage Facing Home Services Businesses?
Twenty job openings for every one new skilled worker entering the trades.
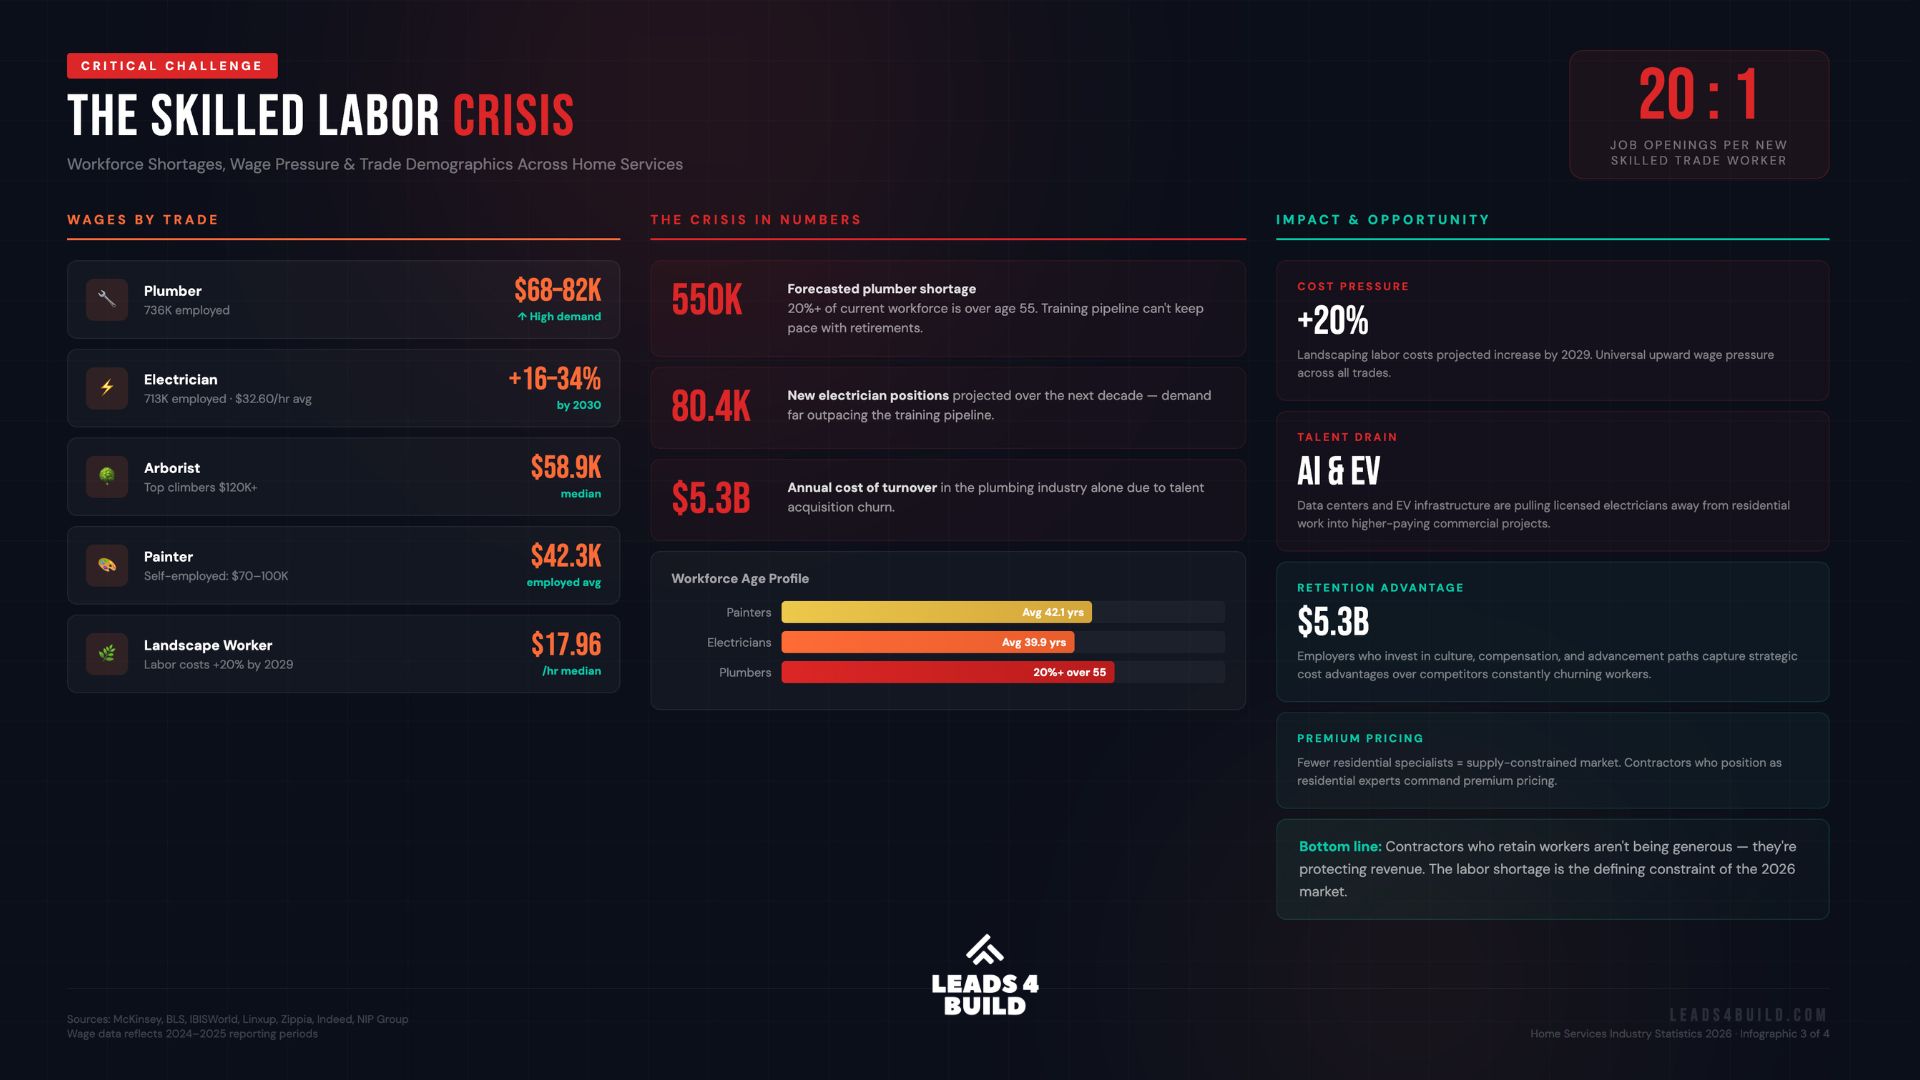
That’s the number McKinsey puts on it [12]. It’s not a minor supply-demand imbalance. It’s a structural crisis playing out across every segment of the industry simultaneously, and it explains most of the operational pain contractors report when they talk about growth.
The consequence is predictable: wages are rising, hiring costs are rising, and contractors who can’t attract and retain workers are leaving revenue on the table. Companies that invest in their workforce (compensation, working conditions, tools, and training) aren’t just doing the right thing. They’re building a durable competitive advantage in a seller’s market for labor.
How Is the Labor Crisis Showing Up in Wages and Hiring Costs?
Wage inflation varies by trade but is universal in direction. Plumbers now earn $68,000–$82,000 on average [47]. Electricians average $32.60 per hour, with cumulative wage growth of 16–34% projected by 2030 [43]. Landscape workers earn a median $17.96 per hour [37], up significantly from prior years, with labor costs forecast to rise 20% further by 2029 [39].
The cost of turnover compounds the wage pressure. In the plumbing sector alone, talent acquisition churn costs the industry $5.3 billion per year [47].
Contractors who retain workers aren’t being generous. They’re protecting revenue.
How Large Is the Painting Contractor Industry in 2026?
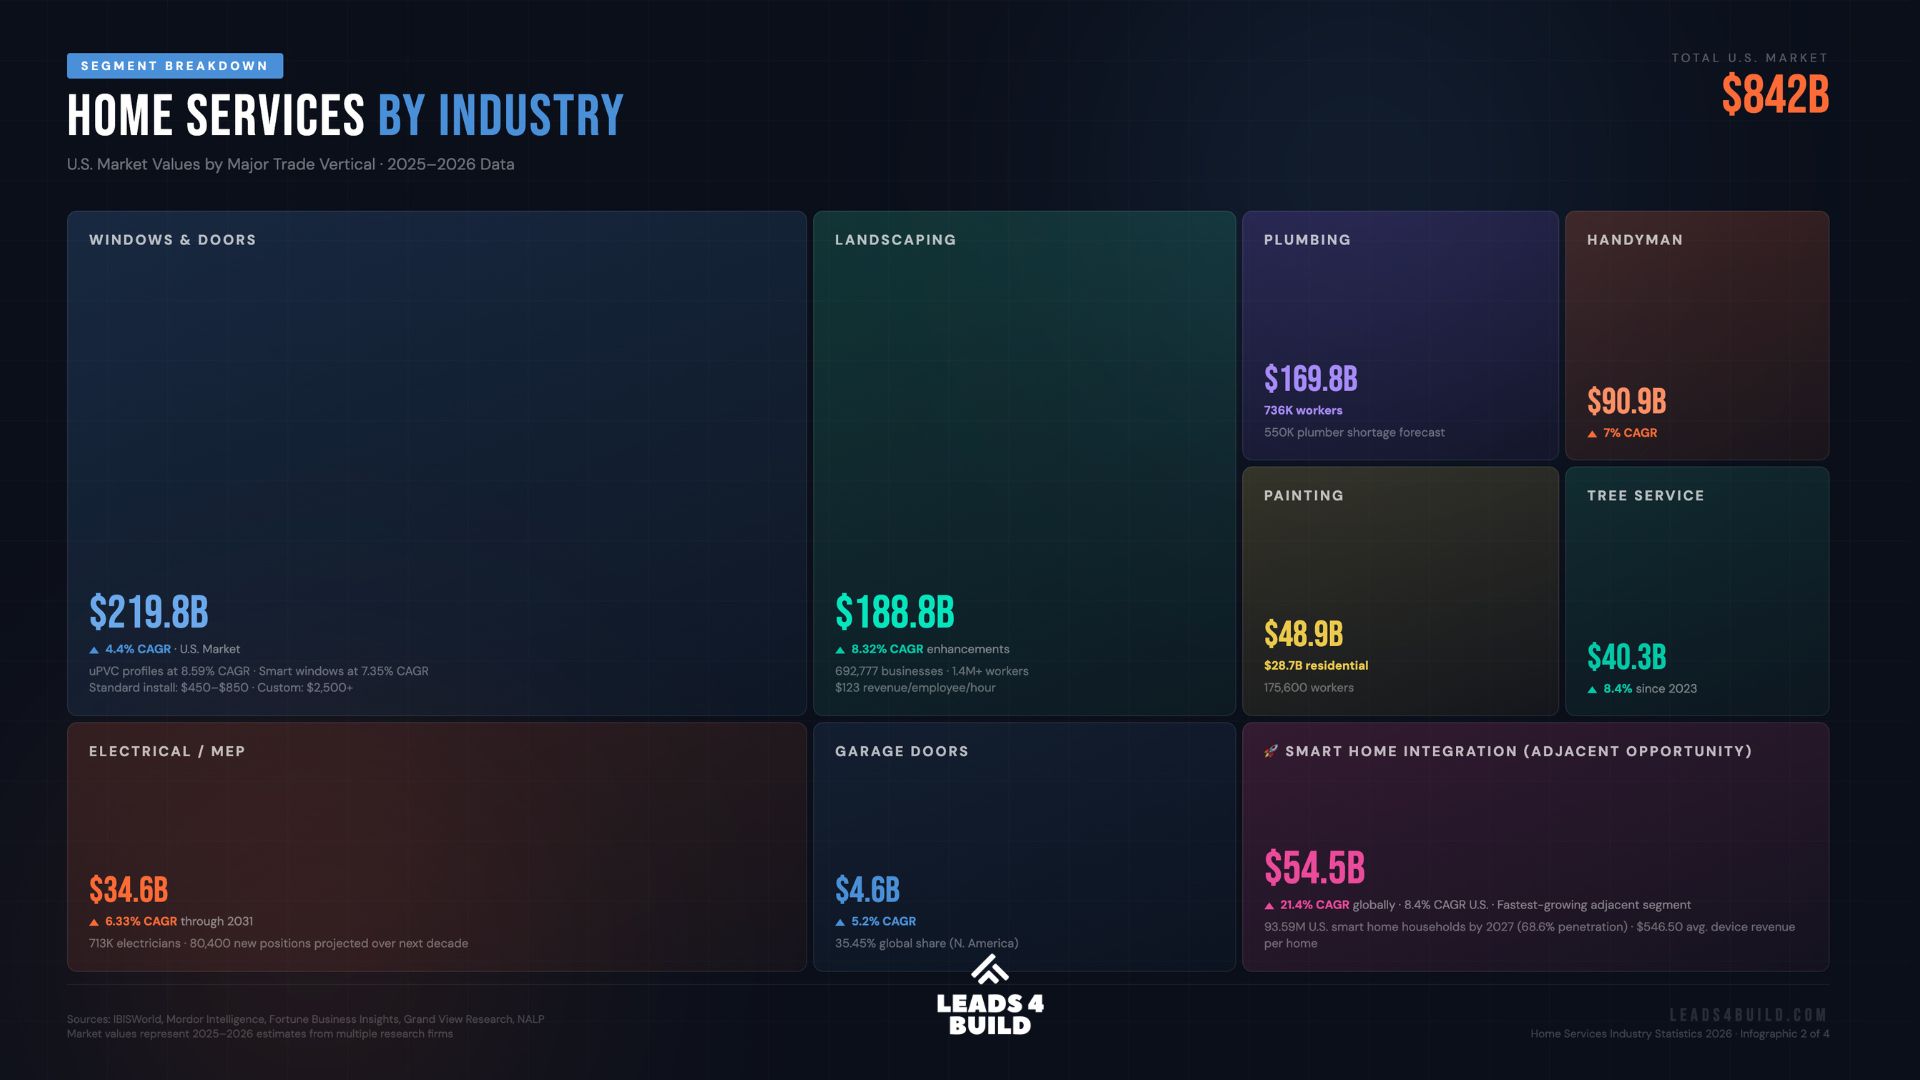
Painting is one of the most mature trades in home services, and the numbers show it. The U.S. painting contractor market is valued at $48.95 billion in 2026 [21], with the residential segment accounting for $28.72 billion of that total [22]. The industry is highly fragmented, dominated by small owner-operated businesses rather than national chains, which creates both opportunity and price pressure for professional painters competing on quality rather than cost alone.
For context on how painting fits into the broader renovation market, the Home Remodeling Statistics article covers renovation spending trends in detail.
What Are the Demographics and Earnings of U.S. Painters?
The painting workforce comprises approximately 175,600 workers, with 16,700 annual job openings projected through 2034 [23]. The workforce skews heavily male (86%) with an average age of 42.1 years [24]. That’s an aging demographic signaling a coming recruitment challenge similar to the one already hitting electrical and plumbing trades.
Earnings vary sharply by employment structure. Employed painters earn an average of $42,339 per year [25], while self-employed painting contractors earn $70,000–$100,000 [25]. That gap reflects the value of entrepreneurship and direct customer relationships in this segment.
The tools used on the job are evolving rapidly. The global painting tool market is valued at $12 billion in 2026, growing to $15.8 billion by 2035 at a 3.1% CAGR [26]. Airless painting systems represent a $1.42 billion market in 2025, growing at a 6.3% CAGR [27] as professional painters increasingly prefer spray application over roller and brush methods.
| Brand | Market Position | Known For |
|---|---|---|
| Graco | Market leader in airless systems | Industrial-grade reliability, wide contractor adoption |
| Wagner | Mid-market, residential and light commercial | Accessible price points, broad retail availability |
| SATA | Premium finish quality | Preferred for automotive and high-end interior finishes |
| Titan | Growing professional segment | Cordless battery models launching; direct Graco competitor |
How Big Is the Tree Service Industry in 2026?
If you run a tree service business, the market trajectory should give you confidence. The U.S. tree trimming and removal industry has grown to $40.39 billion in 2026, up from $37.25 billion in 2023 [29]: an 8.4% increase over three years. The number of tree service businesses has grown from 156,279 in 2023 to 183,223 in 2026 [30], with total employment of 348,691 workers [31].
What Do Tree Service Workers Earn and What Equipment Do They Use?
Certified arborists earn a median of $58,900 per year ($26.18/hr) [32], though top climbers and metropolitan arborists in high-demand markets can exceed $120,000 [32]. That earnings ceiling is unusually high for a trade that doesn’t require a four-year degree. It reflects the specialized skill, physical risk, and equipment investment required for professional tree work.
For a real-world look at how tree service businesses are generating leads through paid advertising, see our tree service advertising case study.
The chainsaw and outdoor power equipment market is competitive in tree care, with several major brands competing for professional loyalty [35]:
| Brand | Market Share | Positioning |
|---|---|---|
| Husqvarna | 27.2% | Professional-grade chainsaws, arborist preferred; strong dealer network |
| Stihl | 18.8% | Dealer-only distribution; fiercely loyal professional following |
| TTI (Milwaukee) | 17.7% | Battery tool ecosystem; rapid growth through Milwaukee brand extension |
| Echo (Yamabiko) | 13.9% | Value-focused; popular with municipal and commercial crews |
| Makita | 7.2% | Superior battery technology; growing share among battery-platform loyalists |
Stihl’s 18.8% share [35] is particularly notable given that Stihl sells exclusively through authorized dealers. That distribution constraint limits volume but reinforces brand prestige among serious professionals. TTI’s growth to 17.7% via the Milwaukee brand extension [35] signals the accelerating shift toward battery-powered outdoor equipment, even in demanding tree work applications.
What Is the Size and Scope of the Landscaping Industry in 2026?
One of the largest trade sectors in the country. The U.S. landscaping industry is valued at $188.8 billion in 2025 [36], supporting 692,777 businesses and more than 1.4 million workers [36]. That makes it one of the most employment-intensive segments in all of home services.
The economics at the firm level are significant. The average landscaping business generates $123 in revenue per employee per hour [36], with median firms serving approximately 355 customers at an average annual value of $14,682 per customer [36]. For landscaping business owners looking to grow, the Landscaping Marketing Strategy guide covers client acquisition and retention in depth.
Landscape enhancements (design, installation, and specialty services) are growing at 8.32% CAGR [38], outpacing the broader market. For a full breakdown of trends and opportunities in this sector, the Landscaping Industry Statistics article provides comprehensive data by segment.
What Labor and Cost Pressures Are Landscaping Businesses Facing?
The labor situation in landscaping is acute. The median grounds maintenance wage is $17.96 per hour (2023) [37], relatively low given the physical demands of the work, which creates persistent recruitment challenges. Labor costs are projected to rise approximately 20% by 2029 [39], forcing landscaping businesses to evaluate automation, route optimization, and service mix changes.
The businesses best positioned to absorb rising labor costs are those with strong recurring revenue from maintenance contracts, higher-margin enhancement work, and efficient scheduling systems that maximize billable hours per crew member. Geographic market selection also matters: metro areas with higher median household incomes consistently support higher service prices that offset wage inflation more effectively. For landscapers looking to grow organic lead flow cost-effectively in a high-labor-cost environment, landscaping SEO offers a lower customer acquisition cost than paid channels.
How Large Is the Electrical Contractor Industry in 2026?
Why are residential electricians busier than ever while commercial shops are turning away work? The answer is structural, and it starts with the numbers.
The U.S. mechanical, electrical, and plumbing (MEP) services market is valued at $34.61 billion in 2026, growing at 6.33% CAGR through 2031 [40]. Approximately 713,000 electricians are currently employed in the U.S. [41], with more than 80,400 new positions projected over the next decade [42]. That’s demand far outpacing the current training pipeline.
The electrician workforce is aging alongside other trades: the median age is 39.9 years [41], and retirements over the next decade will accelerate the demand-supply gap. The wage trajectory for those who do enter the trade is attractive: electricians currently average $32.60 per hour [41], with cumulative wage growth of 16–34% projected by 2030 at a 3–6% annual rate [43].
For a complete breakdown of what this means for HVAC and electrical marketing specifically, the HVAC local SEO guide covers local search strategies for residential mechanical trade contractors in detail.
Where Is Electrical Labor Being Pulled Away From Residential Work?
The most significant competitive pressure on residential electrical contractors is not other contractors. It’s large commercial and industrial projects. AI data centers and EV charging infrastructure are monopolizing industrial electrical labor [44] in many markets, pulling journeymen and master electricians toward higher-paying commercial projects and leaving residential contractors struggling to staff jobs.
This creates a meaningful opportunity for residential specialists. Homeowners wanting smart home upgrades, electrical panel replacements, EV charger installations, and solar-ready wiring work need licensed electricians, and there are fewer available for residential work. Contractors who position explicitly as residential specialists and build the customer experience to match can command premium pricing in a supply-constrained market. Contractors who want to build that specialist positioning can find a full framework in the electrician advertising guide.
How Large Is the Plumbing Industry and What Challenges Does It Face in 2026?
The plumbing industry is in demographic freefall.
The U.S. plumbing industry generates approximately $169.8 billion annually [47], employing 736,000 workers with average salaries ranging from $68,000 to $82,000 [47]. But the industry is heading toward a forecasted shortage of 550,000 plumbers [47], and more than 20% of the current plumbing workforce is over age 55 [47]. Training programs are not producing replacement volume anywhere near the rate required to meet demand.
The workforce is retiring faster than it’s being replaced, and no technology fixes that overnight.
The cost of workforce instability in this sector is measurable and enormous. Talent acquisition churn costs the plumbing industry $5.3 billion per year [47]. Employers who invest in culture, compensation, and advancement paths are reducing turnover and capturing a strategic cost advantage over competitors constantly cycling through expensive hiring and onboarding.
What Technology Trends Are Reshaping the Plumbing Business?
Digital technology adoption is accelerating throughout the plumbing trade. Fleet telematics are growing at 14% CAGR (2025–2033) [47], enabling route optimization and fuel use reductions of up to 20% [47]. The smart water management market (connected leak detectors, smart shutoffs, water monitoring systems) is projected to reach $50.7 billion by 2033 [47]. Even at the entry level, 78% of new plumbers are using at least one digital technology on the job [47].
Two brands dominate the professional plumbing tool market with distinct niches. Ridgid holds the professional standard for hand tools, pipe threading, and wrenches. Milwaukee has made significant inroads with its press-tool ecosystem, where battery platform compatibility drives adoption among plumbers already invested in the M18 system. The two brands largely coexist: Ridgid dominant in traditional pipe-work tools, Milwaukee leading in cordless and press technology.
How Big Is the Handyman and General Contractor Market in 2026?
The U.S. handyman market is valued at $90.95 billion in 2026, growing at a 7% CAGR [50], one of the stronger growth rates among all home services segments. The category benefits from fragmented demand, relatively low barriers to entry for skilled tradespeople, and the rising preference for professional service over DIY noted earlier.
Where Are Contractors Buying Their Tools and Supplies in 2026?
The global cordless power tool market stands at $30.92 billion in 2026, projected to reach $45.74 billion by 2034 [51]. Retail channel dynamics reflect both the dominance of the home improvement big box stores and the growing role of e-commerce [54]:
- Home Depot: 28% unit share / 30% dollar share of power tools [54]
- Lowe’s: 19% unit share [54]
- Amazon: 13% market share [54]
The professional tool market is defined by battery platform loyalty. Once a contractor is invested in a battery ecosystem, switching brands means replacing every tool and battery. This creates fierce brand tribalism and drives purchasing decisions across the industry [52]:
| Brand | Position | Key Platform | Distinguishing Trait |
|---|---|---|---|
| DeWalt | Mass professional | 20V MAX / 60V FLEXVOLT | Legendary durability; largest installed base |
| Milwaukee | Premium trade professional | M12 / M18 / MX FUEL | Innovation leader in 2026; preferred by plumbers, electricians |
| Makita | Fiercely loyal professional base | 18V LXT / 40V XGT | Superior battery tech and ergonomics; deep product breadth |
| Ridgid | Mid-tier professional | 18V | Sold through Home Depot; excellent warranty |
| Ryobi | DIY / entry professional | 18V ONE+ | Shares TTI platform with Ridgid; accessible price |
| Metabo HPT | Mid-tier professional | 18V MultiVolt | Rebranded Hitachi; strong in framing and finish |
| Craftsman | Value / entry | 20V MAX (Lowe’s exclusive) | Rebranded Stanley Black & Decker; budget segment |
Battery platform lock-in is the defining commercial dynamic in the professional tool market. DeWalt’s 20V MAX system has the largest installed base, Milwaukee’s M18 platform has the most aggressive new product pipeline, and Makita’s 18V LXT has an unmatched depth of compatible tools. Contractors choosing a primary platform in 2026 are making decisions that will shape purchasing behavior for the next decade.
How Large Are the Windows and Doors Markets in 2026?
The global windows and doors market is valued at $286.64 billion in 2026, growing at a 4.4% CAGR [55]. The U.S. market alone is valued at $219.86 billion [56], making it one of the largest discrete segments within the broader home services and construction ecosystem. A standard window installation ranges from $450 to $850 installed, while custom configurations exceed $2,500 [58].
Which Window and Door Technologies Are Growing Fastest?
Two technology segments are outpacing the broader market. uPVC window profiles (PVC-based frames offering excellent insulation and low maintenance) are growing at 8.59% CAGR [57], driven by replacement demand in the aging housing stock. Smart and photovoltaic windows (incorporating sensors, electrochromic glass, or solar energy collection) are growing at 7.35% CAGR [57], a signal of where premium window technology is heading over the next decade. For window installers, that means customers asking about energy efficiency and smart glass are no longer outliers — they’re the direction the market is moving.
The window brand landscape is clearly stratified by market segment and customer type:
| Brand | Segment | Key Products | Market Notes |
|---|---|---|---|
| Andersen | Premium mainstream | 400 Series, Fibrex composite | Nationwide availability; trusted contractor brand |
| Pella | Premium / coastal | Impervia fiberglass, impact-resistant lines | Preferred for high-wind and coastal applications |
| JELD-WEN | Budget replacement / tract housing | Standard wood and vinyl | High volume, new-construction and budget replacement |
| Ply Gem | Budget new construction | Vinyl double-hung, sliders | Widely specified in entry-level new construction |
| Marvin | Ultra-premium custom | Wood, aluminum-clad, architectural series | Specified by architects; project-level pricing |
| Loewen | Ultra-premium custom | Aluminum and wood cladding | Canadian manufacturer; architectural niche |
Andersen and Pella represent the professional contractor sweet spot: premium enough to justify installation labor and deliver client satisfaction, but accessible enough to specify across a wide range of project budgets. JELD-WEN and Ply Gem dominate volume in new construction where price per unit drives specification decisions. Marvin and Loewen operate in a separate universe of custom architectural projects where budget is secondary to aesthetics and performance.
How Large Is the Garage Door Industry in 2026?
The global garage door market is valued at $8.56 billion in 2026, projected to reach $12.84 billion by 2034 at a 5.20% CAGR [62]. U.S. demand accounts for $4.6 billion [63] of that global total, with North America holding a 35.45% global market share [64]. That disproportionate share is driven by the prevalence of attached garages in American residential construction.
What Is Driving Growth in the Garage Door Sector?
Two product categories are growing faster than the broader market. Aluminum-glass hybrid doors are growing at 6.98% CAGR [64], reflecting the design-forward preferences of remodeling homeowners willing to pay premium prices for curb appeal.
North America holds 90% of the global smart garage door opener market share [65] — an extraordinary dominance reflecting the high garage penetration rate and above-average smart home adoption in U.S. homes. Chamberlain Group (which owns both Chamberlain and LiftMaster) and Genie account for approximately 80% of the U.S. opener market combined [66]:
| Brand | Owner | Price Range | Primary Channel | Key Market |
|---|---|---|---|---|
| LiftMaster | Chamberlain Group | $230–$920 | Professional installation | Commercial; used by ~50% of U.S. construction firms [67] |
| Chamberlain | Chamberlain Group | $159–$499 | Home Depot / Lowe’s | DIY and consumer replacement |
| Genie | Overhead Door / GMT | Mid-range | Retail + professional | Legacy residential; user-friendly interface |
LiftMaster’s dominance in the professional and commercial channel (used by 50% of U.S. construction firms [67]) reflects a distribution and relationship strategy focused on contractors rather than consumers. Chamberlain, despite being owned by the same parent company, occupies the consumer retail channel, creating a deliberate two-tier strategy that maximizes market coverage.
How Is Smart Home Adoption Reshaping the Home Services Industry?
No other segment adjacent to home services is growing faster than smart home technology.
![]()
The global smart home market was valued at $147.52 billion in 2025 and is projected to reach $848.47 billion by 2034 — a 21.40% CAGR [69]. The U.S. smart home market specifically is valued at $54.53 billion in 2026, growing at 8.40% CAGR [70].
No other segment adjacent to home services is compounding this fast.
Adoption is approaching majority-household penetration. 93.59 million U.S. households are projected to be active smart home users by 2027, a 68.6% penetration rate [71]. The average smart home generates $546.50 in connected device revenue [71], a number that is growing as product categories multiply beyond thermostats and door locks into security, lighting, appliances, and plumbing monitoring.
What Revenue Opportunity Does Smart Home Create for Contractors?
AI-driven predictive maintenance is projected to contribute +0.3% to home services market CAGR [1] as systems that detect problems before failure become mainstream. For contractors, this creates a service model opportunity: the monitoring subscription and emergency response relationship, rather than purely reactive break-fix work.
Consider what that looks like in practice. Electricians who can install EV chargers, smart panels, and whole-home energy monitoring. Plumbers who can configure smart water shutoffs and leak detection systems. HVAC technicians who can commission connected thermostats and air quality monitors. Each of these represents a premium service tier that the average homeowner can’t DIY and that commands margins well above standard service work.
In a sector where customer satisfaction is mediocre at the industry average (76.9/100 [72]), contractors investing in technology, communication, and professionalism are pulling significantly ahead. Smart home integration positions service businesses as technology partners rather than commodity labor. That commands premium pricing and generates stronger customer retention.
What Is the Strategic Outlook for Home Services Businesses in 2026 and Beyond?
The home services industry in 2026 is defined by a productive tension: demand is strong and growing, but operational capacity is constrained by labor shortages that won’t resolve quickly. That tension is not equally distributed across the market. It rewards well-managed, professionally branded businesses and punishes under-capitalized, poorly organized ones.
The homeowner confidence data tells a clear story. With 85% planning to maintain or increase spending [11] and 90% more inclined to hire a professional than three years ago [11], the demand side is favorable. The constraint is supply: finding, training, and retaining the workers needed to service that demand.
Which Home Service Sectors Offer the Strongest Growth Opportunity?
Several segments stand out based on CAGR and structural demand drivers:
Smart home integration services represent the highest-growth opportunity for technically capable contractors, supported by a 21.40% CAGR in the underlying product market [69] and a homeowner adoption curve still in its steep phase.
The handyman and general contractor market at 7% CAGR [50] reflects broad demand from homeowners who want single-call convenience for multi-trade projects.
Tree service at 8%+ growth since 2023 [29] continues to benefit from extreme weather events driving emergency removal demand and an aging urban tree canopy requiring proactive management.
Landscaping enhancement services at 8.32% CAGR [38] reward businesses that have moved beyond maintenance mowing into design, installation, and specialty services where margins are substantially higher.
The electrical and plumbing trades face severe labor shortages but offer extraordinary wage appreciation: 16–34% cumulative wage growth through 2030 for electricians [43] and average plumber salaries already reaching $82,000 [47].
For contractors in renovation and remodeling specifically, the structural dynamics are equally compelling. The home remodeling statistics article details the renovation market data, and the Google Ads strategy for remodelers covers how to capture that demand with paid search effectively.
What Do These Numbers Mean for Your Business?
The home services industry in 2026 is large, diverse, and structurally sound. At the macro level, the U.S. market spans $842 billion [4] across all segments, underpinned by 36-year-old median housing stock [5] that requires constant professional attention and $608 billion in annual homeowner spending [6] that shows no sign of declining.
The critical variables for individual businesses are operational rather than market-driven. Labor shortages of 20:1 in skilled trades [12] are real and worsening. Digital booking expectations (84% starting on mobile [7]) are non-negotiable. Brand recognition matters to 96% of homeowners making hiring decisions [10].
The contractors winning in this environment share a common profile: they invest in their workers, present professional digital identities, adopt the technology their customers expect, and specialize enough to command premium pricing in their markets.
The data in this article shows where the industry is. What you do with that position is the only variable that remains.
If you want to see how these market dynamics play out in your specific trade: HVAC, remodeling, landscaping, or solar, we’ve built full marketing guides for each vertical. Start with the one that matches your business.
